
The need to describe a collection of like objects is a common analysis task. The primary purpose of this presentation is to illustrate the Polynary approach. The Polynary program handles problems where objects have up to eight quantitative dimensions—about as complex as anything most people think and talk about.
Part 1: The Visualization of Like-Objects in Polynary—an Example
Psychologists have long thought about the notion of personality. Personality is an abstraction -- there is no way to measure it directly. They often characterize personality through five attributes called the Big Five. A self-assessment survey of 20 questions provides a score for each of these dimensions. Higher attribute scores mean a personality feature is more pronounced.
Thought about in this way, personality is a multi-dimensional concept, a point in a five-dimensional space. While a five-dimensional space logically exists in math, we can’t imagine it geometrically in traditional Cartesian terms. The Polynary coordinate system splays this 5-dimensional space onto a two-dimensional surface like that in Figure 1.
Figure 1: Personalities in a Sample of 1305 People
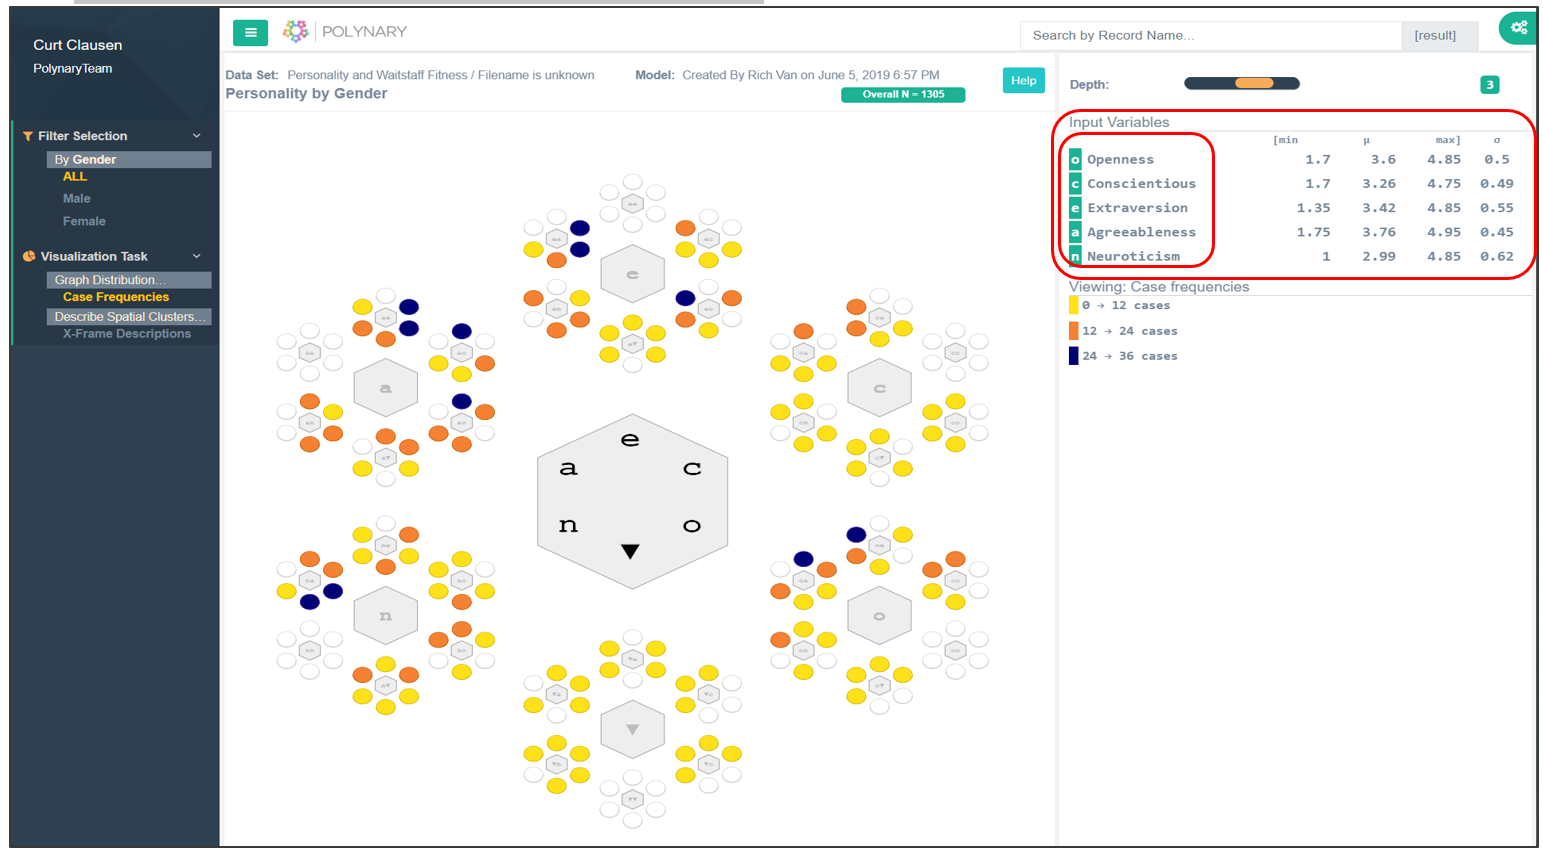
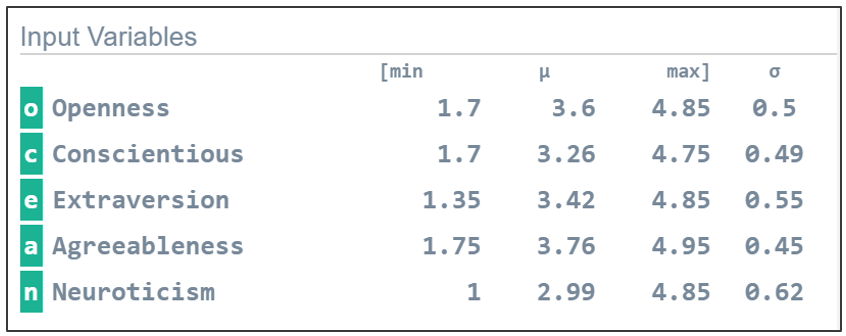
The 5 personality dimensions are displayed in the legend as the Input Variables. We use the associated symbols to denote these variables on the graph. Across from each dimension is the minimum, average, and maximum value along with its standard deviation. These conventionally reported statistics help document the given data sample. The theoretical range of each dimension runs from one to five. People are like-objects because we all have scores on these dimensions.
What distinguishes people is the relative degree to which these five personality dimensions animate who we are. The 3-D limitation of Cartesian graphs meant that we could talk about personality, but we could never see it. Polynary graphs make abstract spaces tangible to the visual system.
A person is the smallest logical unit of analysis, it takes a consideration of all five values to characterize one person’s personality. The Polynary representation binds these five values into a single Polynary string. Each circle on this graph represents a different string. You can think of a string as a kind of generalization of binary. Instead of a string of zeros and ones, each string uses multiple symbols. The spelling of this string reflects the ways their personalities are most notable. And because we can plot these strings on a fractal coordinate system, we can see these personality profiles by what distinguishes them.
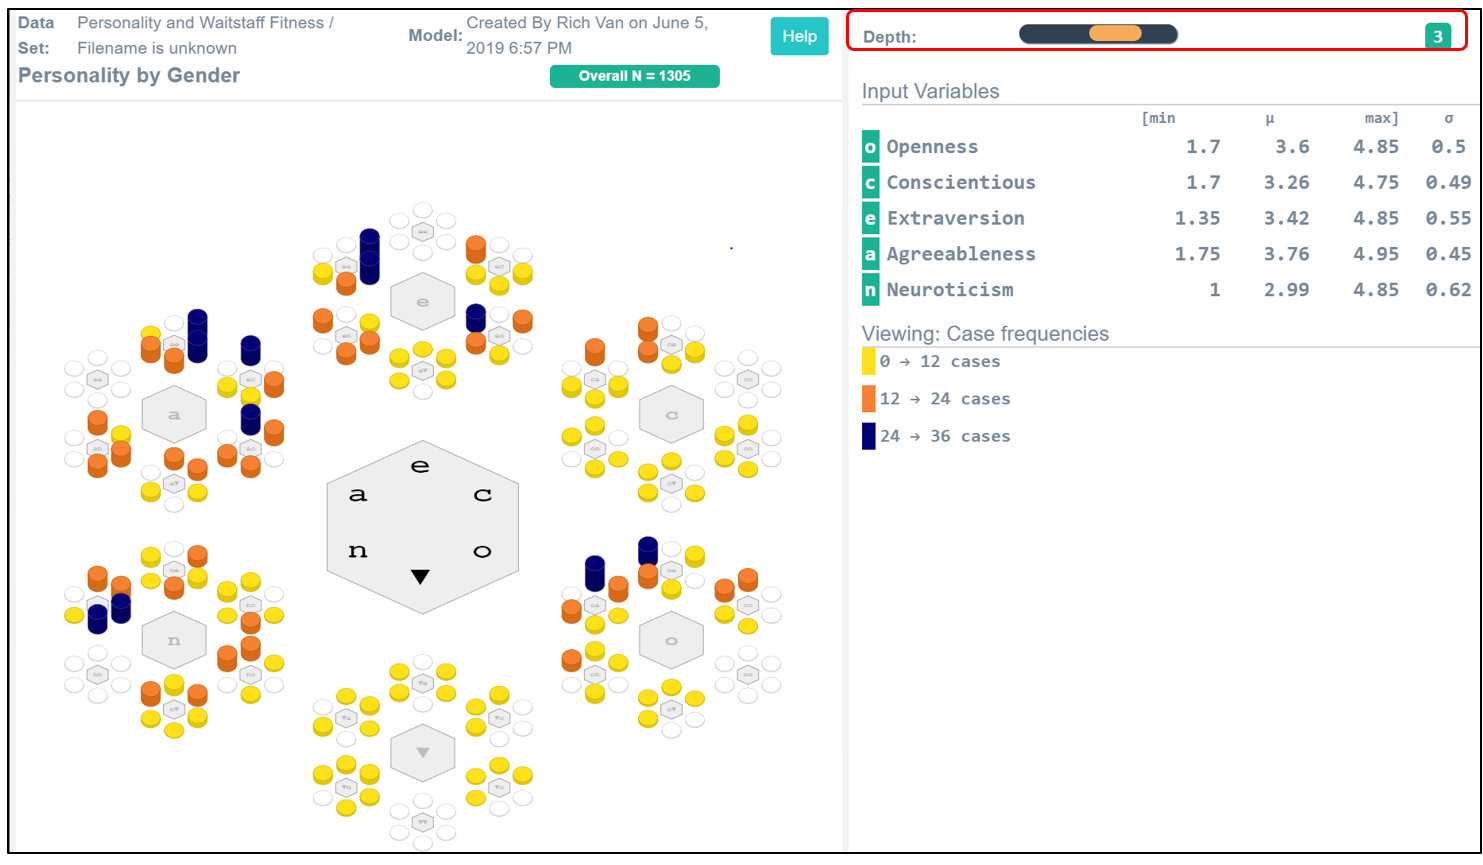
This graph summarizes the personalities of 1305 people using Polynary strings 3 symbols long. The colors and the height of the bars over each corresponding basin encode the number of people with the same personality profile.We can better see the frequency of these personality profiles by using the tilt feature as shown in Figure 2. Here, the colors and the height of the bars over each corresponding basin encode the number of people with the same personality profile.
Figure 2 Frequency Distribution of Personality Profiles in the Sample

Framing and Abstractions—a little background
It adds clarification to understand that each dimension in this Big 5 personality model is the average of two aspects. Openness is the average of intellectual curiosity and being open to ideas; Conscientiousness is the average of orderliness and industriousness; Extroversion, the average of enthusiasm and assertiveness; Agreeableness, the average of compassion and politeness; and finally, Neuroticism is the average of volatility and withdrawnness. These definitions operationalize the meaning of the Big Five dimensions in terms of less abstract concepts.
An average of 10 survey items measure each of these ten aspects. In effect each aspect is a construct combined into five even more abstract dimensions. Abstractions of quantifiable notions always work this way; we define each term through less abstract notions until we reach directly measurable concepts.
What do you mean by personality? I mean how Open, Conscientious, Extroverted, Agreeable, and Neurotic a person is. What do you mean by Agreeableness? It is how compassionate and polite you are. What do you mean by polite? It’s the average of ten politeness related items.
Why do people use abstractions? We use abstractions to support high-level thinking. Abstract notions allow us to think and talk about complex ideas. Simultaneously juggling even 8 different concepts is challenging. High-level ideas often require high-level concepts to respect the limits of working memory. The Polynary program supports the construction of abstractions from measurable things. This allows us to present results at the same level we use to think and talk about them.
Exploring Graphs of Like-Objects
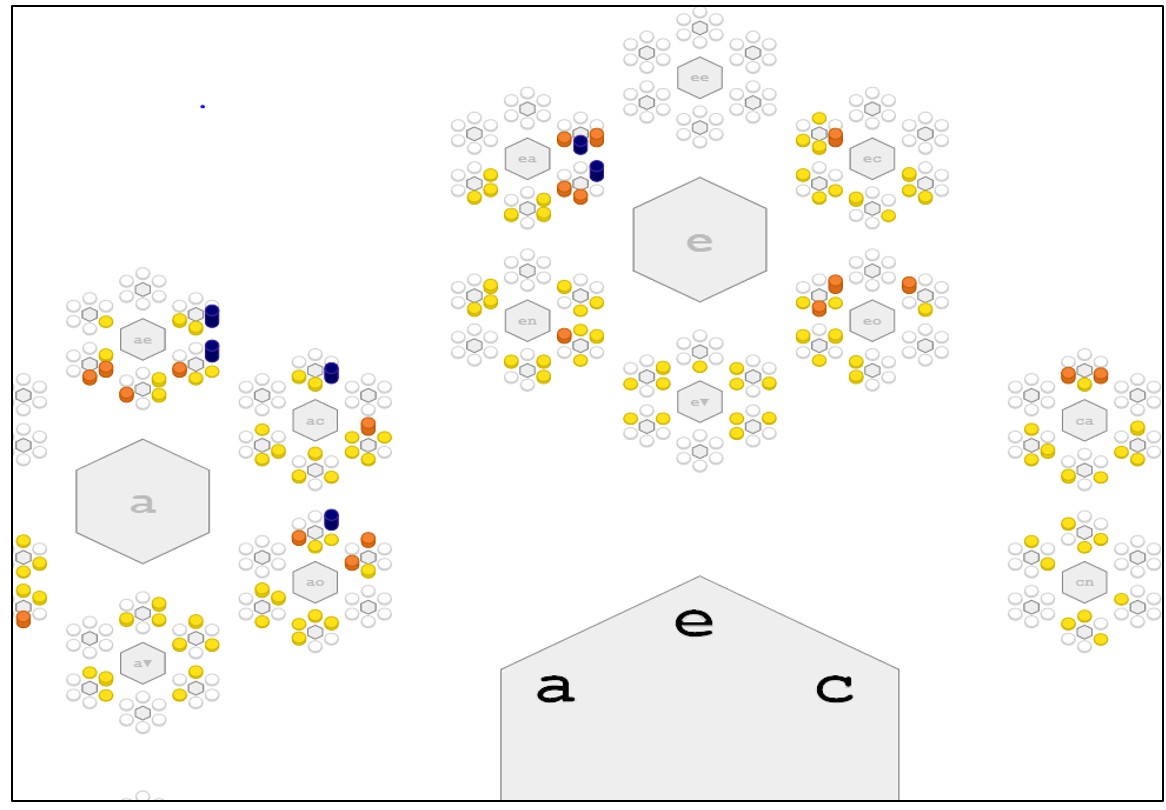
Figure 3 shows personalities based on the rank scores on each dimension. Consequently, the graph basins reflect the relative degree the five dimensions animate the personalities of people relative to others.
For example, some people have Extroversion as their most notable feature, some are most notably Agreeable, and some at the bottom of the graph have more wallflower personalities. Wallflowers are people that fall below the 50th percentile across all the personality dimensions. Their most notable feature is that no personality feature really stands out. Every person is most notable in one of these six ways, and its corresponding symbol is the first symbol in their Polynary string.
The fractal structure divides each of these 6 regions into 6 parts, indicating the second dimensional feature that is most notable. The order of the letters around the graph at this scale, and successive scales, is identical to those of the whole graph.
Figure 3. Personalities Based on Rank Scores on Each Dimension
Agreeable Extraversion Wallflower

For example, if we interactively hover the mouse on the central gray hexagon at the root node we see that there are 1305 cases. When we hover on the center of “o” hexagon, we see there are 217 people with Openness as their most notable feature. If we next move in the ‘a’ direction to “oa’, we see that of these 217 people, 77 have Agreeableness as the second-most notable feature.

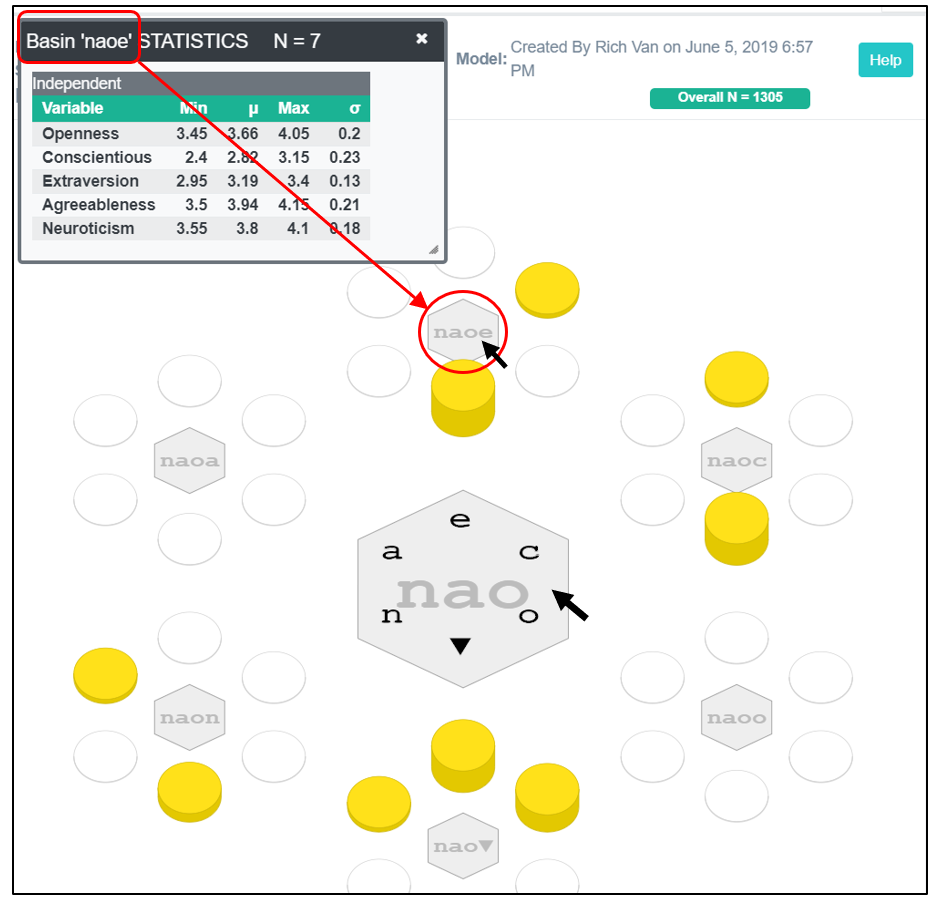
Finally, at the third size scale we can move in one of the 6 labeled directions. For example, hovering over basins ‘oao’ we see that there is one person with this Polynary string.

Notice that the same symbol can appear more than once. This happens because Polynary strings encode more than just the relative noteworthiness of the dimensions but the relative noteworthiness of its dimensional values. The second occurrence of “o” in “oao” tells you that the magnitude of the value for Openness is again the most salient feature relative to the dimensional values of all the alternatives.
To summarize, this “resolution 3” Polynary graph subdivides “personality space” into 216 chunks of six-dimensional space (5 personality factors plus a “slack variable” representing low values of all input measures). The graph shows 1305 distinct individuals that fall into 128 basins representing different existing personality profiles. And the colors make it apparent that some profiles are more common than others.

and selecting statistics in the pop-up menu, we see a panel showing the minimum, average, maximum, and standard deviation of the 16 cases in this personality profile.

We can also see the basin records by right clicking on a basin and selecting basin records.

Alternatively, if the user defined a ‘Record Name’ column in their file, this case name is shown instead. For instance, this could be the names of the 16 people.
There are two interactive ways to change the level of detail shown in the graph. First, we can click on the center of any region of the fractal graph to zoom into just that part.
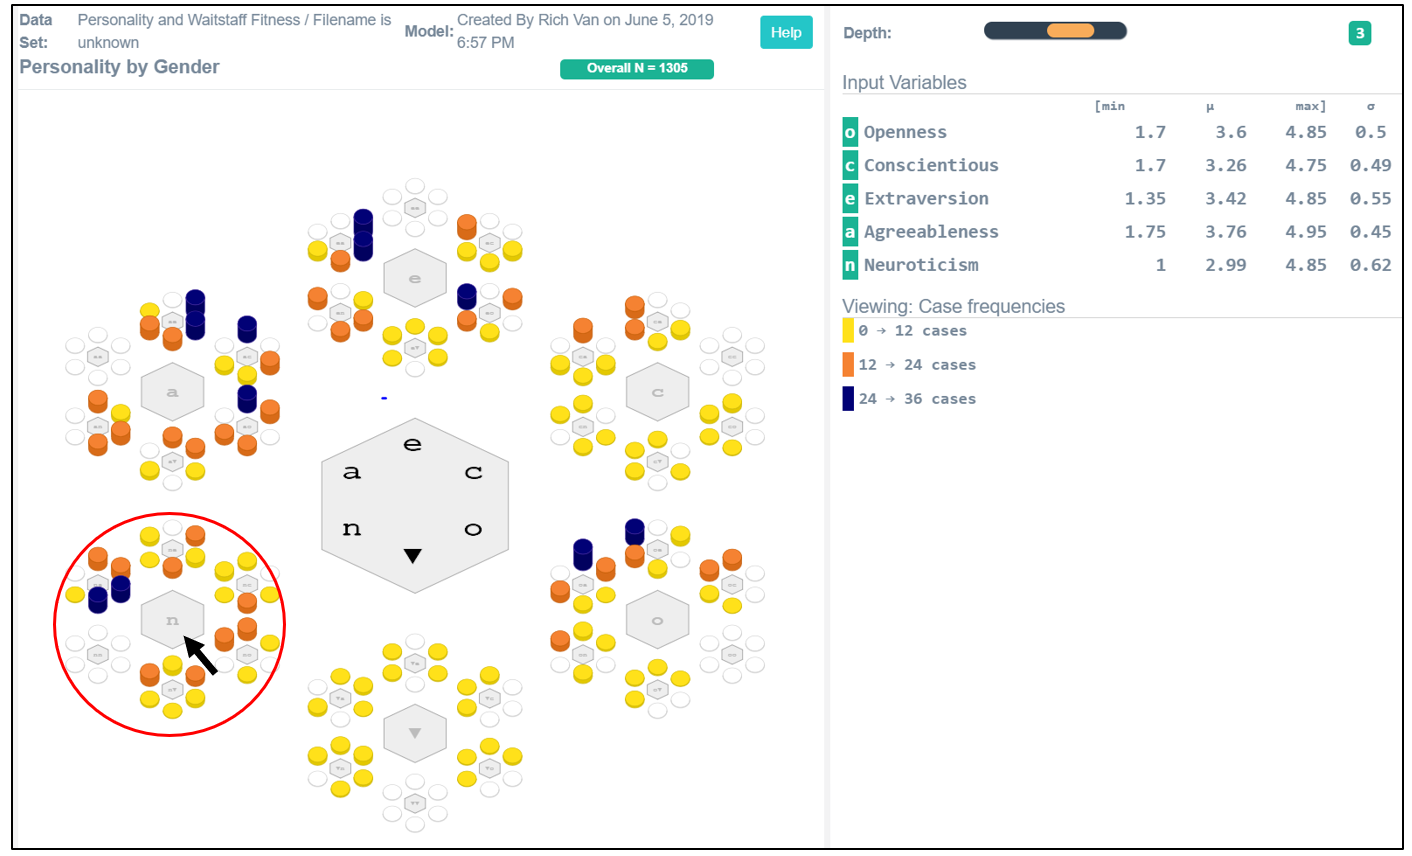
For instance, if we want to further delineate cases where neuroticism is the most noteworthy personality feature, we can click on the center of “n”.

We now see these cases in greater detail through longer Polynary strings. Notice at this level of detail all the basins have fewer than 13 cases.
We can continue in drill down by clicking at the center of a region; for instance, “na”; and again, by clicking on, say “nao”.

Every time we drill down, we are seeing the data in greater numeric detail through Polynary strings of greater length.
Polynary strings can replicate a set of numbers to any degree of precision desired; they are just two different representations of the same thing.
You can un-zoom the graph by clicking on the polygon in the center of the graph.
Another way to change the level of detail is to change the depth slider. In this example, we can increase the depth from three letter strings to strings of length four. There are 1296 basins shown in this graph, a number almost as large as the people in the sample.

The advantage of this approach is that it preserves the context of the whole graph. Your browser may allow you to enlarge this graph to make it easier to explore in greater detail.
The advantage of this approach is that it preserves the context of the whole graph. Your browser may allow you to enlarge this graph to make it easier to explore in greater detail.
Polynary graphs directly represent the objects. There is no Cartesian slicing and dicing through high dimensional space to try to mentally reconstruct a picture of the data. In this graph, the objects are people clustered by their personality profile and the bar heights indicate how frequently each profile occurs. This resolution preserves about 90% of the numeric detail of the five-dimensional personality data of 1305 people.
Part 2: Describing a Sample of Like-Objects in Polynary
Polynary graphs provide a tangible way to see and show high-dimensional data. To extend the utility of Polynary strings we need to provide a little background. In Cartesian terms N measures define a point in an N-dimensional rectangular box. The transformation to the Polynary representation first rescales this box into an N-dimensional unit-cube. The two are equivalent, there is a one-to-one correspondence of points in these two spaces. The unit-cube framework forms a simpler conceptual space where the values of each dimension range between zero and one. We draw on this unit-cube scaling later to select appropriate adverbs in formal language descriptions.
Next, we define the anti-geometric mean of the N-variate values as the slack variable. This additional variate maps the N-values associated with each object onto an (N+1) dimensional hyperplane. The relative magnitude of these (N+1) coordinates maps these values onto something called an N-simplex.
But you can forget all this math jargon. All it really means is that we replace the usual N Cartesian coordinates with (N+1) relative coordinates. The two sets of coordinates represent the same information. We call them relative coordinates because each is non-negative, and together they sum to a value of one. That is, the relative coordinates of each object have the same properties as a set of proportions.
In relative coordinates, each object is a whole expressed through the relative degree of its parts. A Polynary string is just a ‘digitized’ version of relative coordinates; its ‘spelling’ reflects the relative salience of its dimensional features. A geometric consequence is that Polynary divides the unit-cube unlike the graph paper grids we learned in school. Instead, the divisions align with a common strategy used in descriptions; we combine and distinguish objects by citing the relative noteworthiness of their dimensional features.
In this graph we just show the first 3 symbols of these Polynary strings. At this resolution, no string can reference more than three of the five dimensions.

How does this make sense? It doesn’t in the Cartesian system; a point in a five-dimensional space requires a reference to all five dimensions.
Because Polynary works through relative coordinates, the symbols shown in a string explicitly indicate what, in a relative sense, most stands out. From this we know implicitly that the values for any unexpressed symbols stand out less. Each Polynary string represents an N-dimensional chunk of space regardless of its length.
This property mirrors how we already think and talk about high-dimensional objects.For instance, we might assert that: “People that are Conscientious have very tidy desks.”It seems to make sense.We use partial descriptions like this all the time in language.It is a statement with an implicit awareness that this is one personality trait within the context of a larger personality frame.
The statement is a shorthand claim saying: “People that, relative to other personality features, are most notably Conscientious have very tidy desks.” The latter interpretation makes more sense because everyone is Conscientious to some degree, and not all of us have tidy desks.
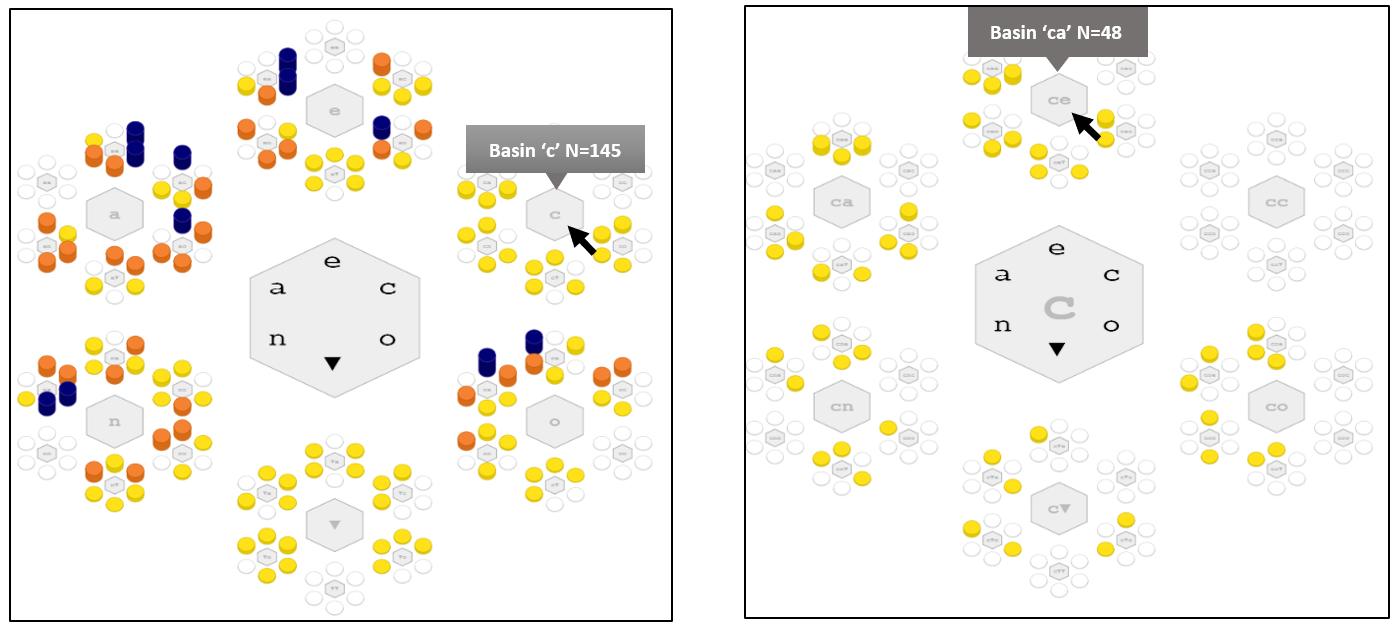
Notice that 145 people are most notably Conscientious. And we point out that this region happens to denote 17.5% of the volume of 5-dimensional unit-cube. This percentage gives a sense of how specific the phrase “People that are Conscientious…” is.

Notice that 145 people are most notably Conscientious. And we point out that this region happens to denote 17.5% of the volume of 5-dimensional unit-cube. This percentage gives a sense of how specific the phrase “People that are Conscientious…” is.
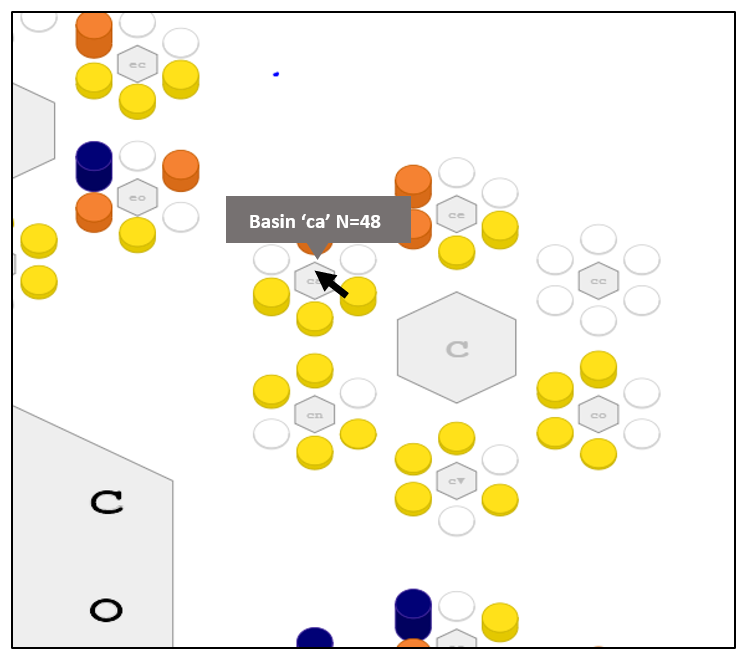
Smaller volumes are more specific. For instance, people that are most Conscientious then Agreeable, basin “ca”, contains 48 people falling into a region that makes up about 3% of the volume
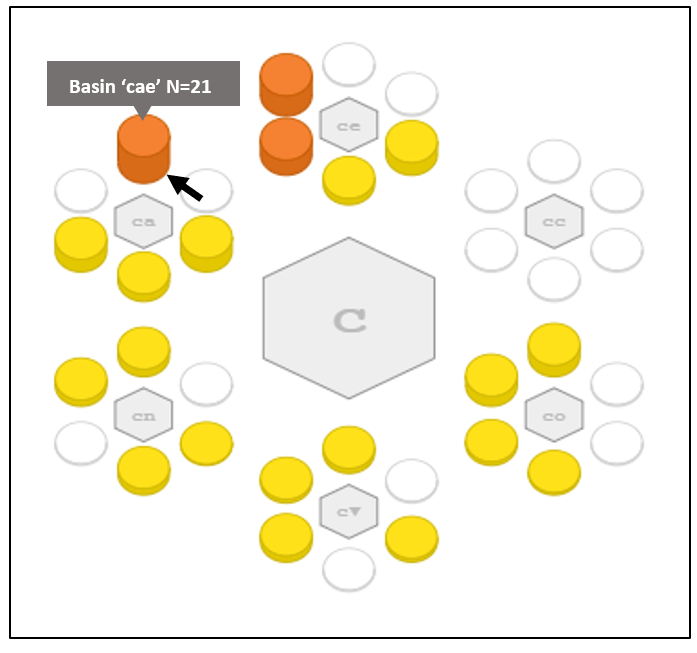
And if we add a third symbol like ‘cae’ we see 21 people fall into a region that makes up about a half of one percent of the volume of the 5-dimensional unit-cube.
We see how quickly the volume decreases with each symbol we add to the string. And as we decrease the volume the corresponding description becomes more specific and complete.
It is important to note that language isn’t about reproducing numeric precision; its strength is its power to form generalizations that draw relevant distinctions. Regardless of the dimensionality, even short strings draw more distinctions than we generally need. This is the primary reason people can quickly characterize a complex object by stringing together just a few adverb-adjective phrases. Geometrically a description connotes the size, location, and shape of a region of conceptual space. And the reason language feels useful and effective is because it allows us to construct millions of characterizations to point to different sub-regions of this space.
The fractal organization of Polynary graphs parallels one way that people use language to describe objects.
The 145 people in region ‘c’ are those where Conscientiousness is relatively high. The 48 people in region ca’ are those where Conscientiousness is very to extremely high, and Agreeableness is barely to very high.
And the 21 people in ‘cae’ are those where Conscientiousness is quite to extremely high, Agreeableness is somewhat to quite high, and Extraversion is exceptionally moderate to somewhat high.

Every time we add a new symbol to the string the region becomes smaller and the description becomes more specific. We implicitly understand that the values of the uncited dimensions are less notable than the cited ones. We discuss the meaning of adverbs and their selection in the Nuts & Bolts of Polynary.
Polynary Language Descriptions
Polynary descriptions mirror how people describe high-dimensional objects while respecting the limits of working memory. It puts a premium on concise descriptions; we want to maximize the amount of accurate information conveyed while keeping the description short. We rarely hear people string together more than three adverb-adjective phrases in a single description. We can’t remember descriptions that ramble on too long.
How can we describe high-dimensional objects in a way we can usefully remember? One way is to reduce the depth of the graph. The current, resolution 3 view displays 216 basins, 128 of which contain data -- meaning there are 128 profile distinctions to draw to describe each personality type in the sample. At this depth each Polynary string is made up of three symbols.
But describing each basin separately would quickly overwhelm our working memory.
Decreasing the Depth reduces the burden.
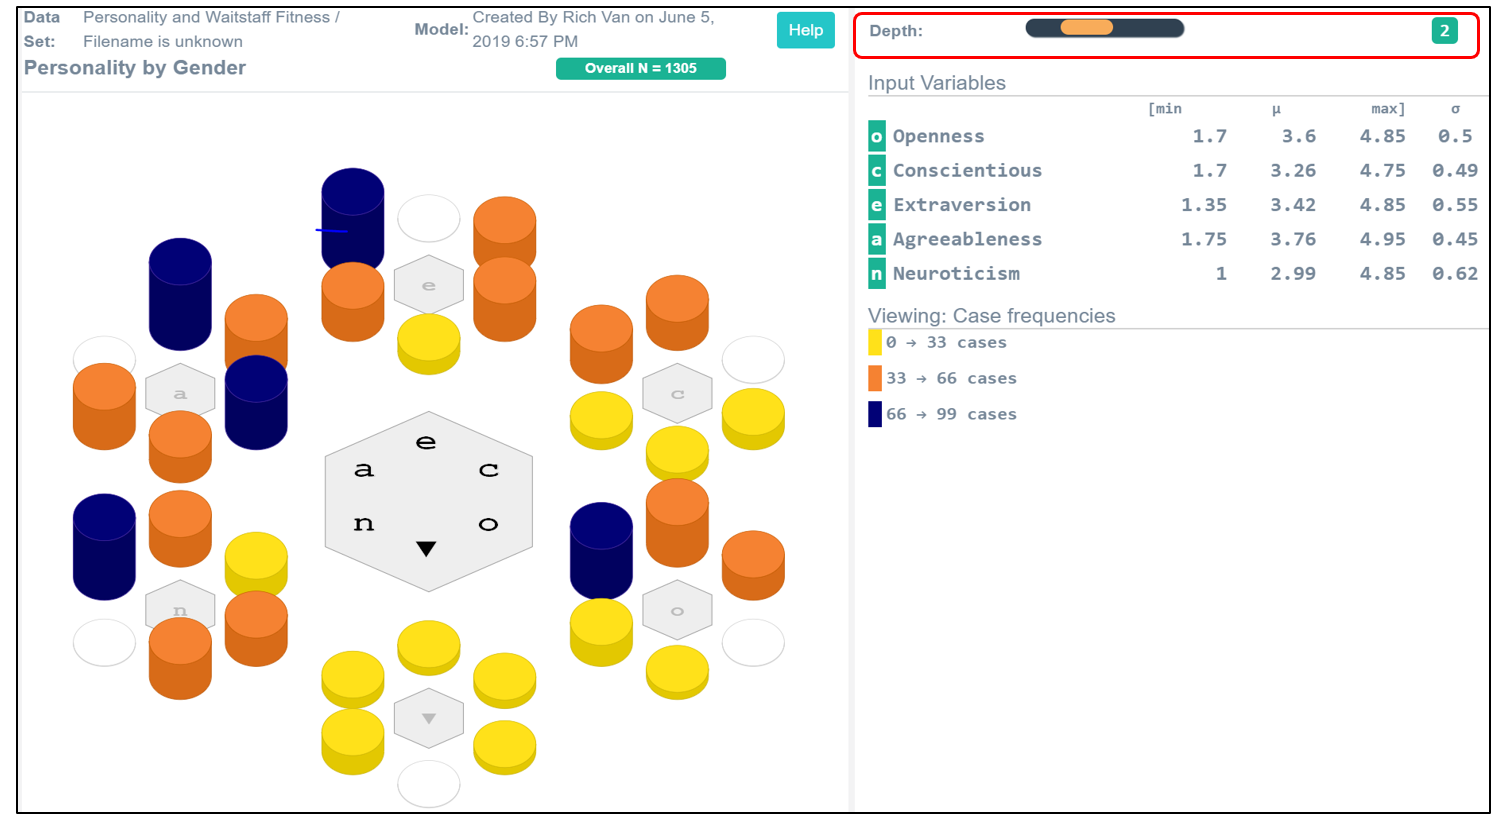
At resolution 2 each basin notes at most 2 dimensions, but there are still 30 separate profiles to characterize.
And at Resolution 1 there are only 6 profiles that characterize each person by the single thing that makes their personality notable. In reducing the depth of the graph we gain simplicity by sacrificing details of the individual profiles. Just like in language, making broader generalizations always comes at the cost of detail.

But people do not seem to form generalizations based on changing the depth slider like we have shown. The data summarized at resolution 2 would be an effective way for comparing one data set to another, but no one would listen to or follow the 30 descriptions of these 30 basins. To reduce the number of descriptions we need a better way to divide the dataspace into fewer regions.
A Polynary basin from an N-dimensional space corresponds to a region surrounded by N to 2N other basins. That is, each basin in this example is adjacent to from 5 to 10 other basins. Joining adjacent basins allows us to define larger regions of more arbitrary size and shape that results in fewer descriptions.
We can look at this example by clicking on X-Frame Descriptions.

Here the 30 basins are summarized into three non-overlapping, color-coded regions. Each corresponding description covers about a third of the cases. We’ll talk about “why these particular three” shortly.
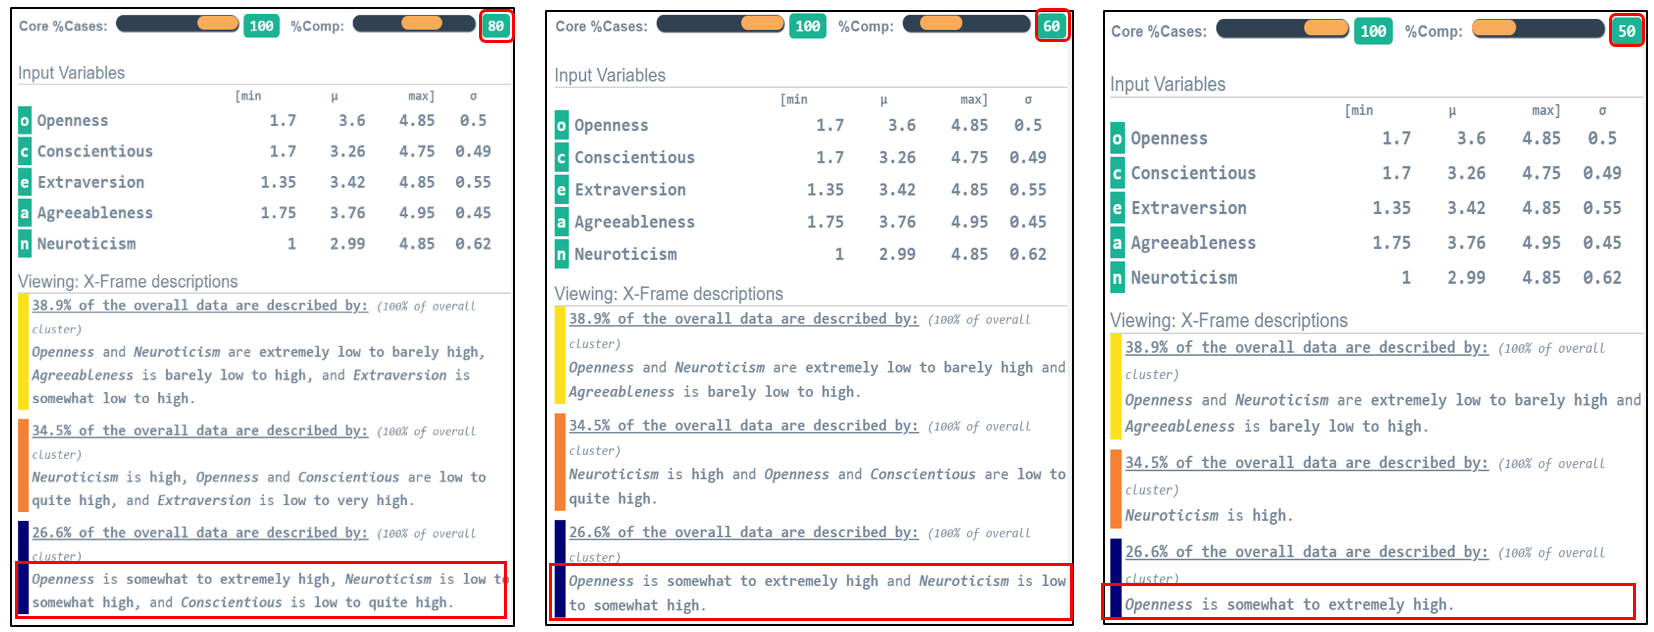
Notice that each description references all five personality dimensions. They ramble on too long to easily remember or form useful conceptual bins. We order the phrases by how much accurate information each conveys. This way we can make descriptions briefer by ‘cutting off’ latter phrases while minimizing the loss of information. Shortened descriptions are easier to retain and compare.
The right amount of detail depends on human purpose. We can change the amount of detail by changing the slider labeled %Comp.
As we slowly decrement slider to 50% we notice that the descriptions shorten as the slider moves.The slider shows the minimum percentage of the accurate information retained relative to the full description.
The second way people modify descriptions is to characterize just the more typical members. For instance, we have all heard statements that start out: “The majority of Americans believe…”. This modification makes descriptions more specific by eliminating the more unusual cases. To do this we use the core % slider.

This single yellow basin contains the greatest fraction, more than 7%, of the personalities in the sample.
Setting %Core=22, these three basins, called seed basins, correspond to all the descriptions that convey more accurate information than any other basin surrounding them. These seed basins account for about 22% of the entire sample through three descriptions.

As we increment the slider, we sequentially join an adjacent basin to whichever seed cluster optimizes the concision of the resulting descriptive account.

Concise means the stating of much in few words. The three descriptions are now the set of the most concise statements that account for a third of the sample.
Continuing to increment %core to 50, we see that 9 basins now account for half of the sample through three optimally concise descriptions.

As we increase the slider the percent of objects covered increases and the corresponding descriptions form broader generalizations to describe the sample.
This makes sense. Covering a larger fraction of the sample comes at the cost of less specific descriptions. The program carefully considers the order that basins join clusters to offer the most concise set of descriptions that cover any given percent of cases.
We have demonstrated two principle ways people simplify descriptions that still distinguish different categories of objects. We can make them briefer by cutting off the least notable detail. And we can simplify them by characterizing only its more typical members.
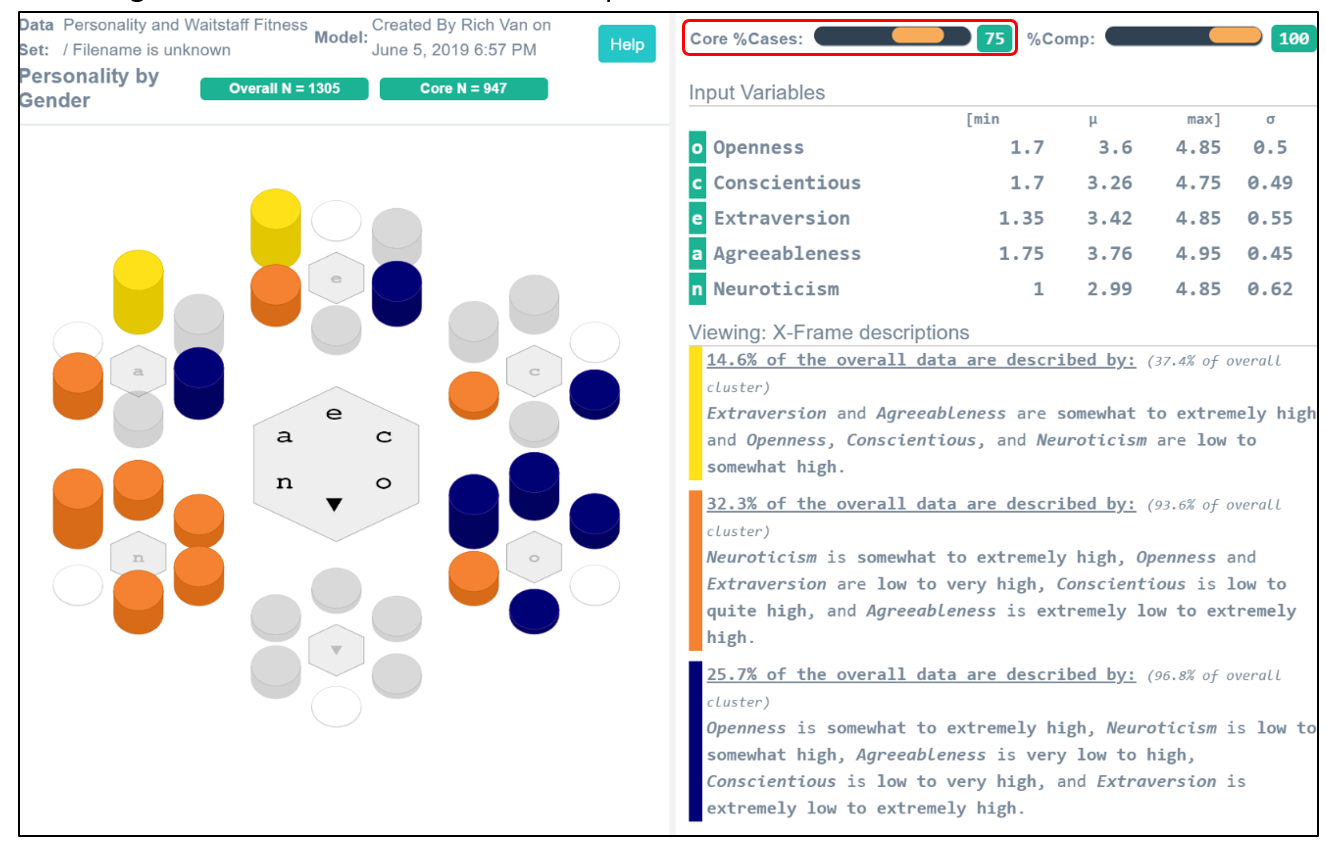
In practice we can use these two principles in combination to satisfy the purpose at hand.Here we cover 75% of the cases while retaining at least 75% of the information in the complete description.There is no one-size-fits-all answer in language; it flexibly depends on human need.

We should be clear that the descriptions will always be unique. Each description is built from a connected set of basins that define a single non-overlapping region of space. Descriptions connote the size, shape, and location of these regions, and they are all different. From a statistical point of view comparable samples should have comparable percentage of cases in these descriptions. This is testable through conventional statistics.
A critical observation to emphasize is that there are an almost uncountable number of ways that these basins could have been joined to form a set of descriptions. We reduce this choice to that which offers the most concise set for the given number of seed basins. By optimizing concision, we connote more accurate information through these descriptions than any other choice.
Pre-Filters for Comparing Collections of Like-Objects
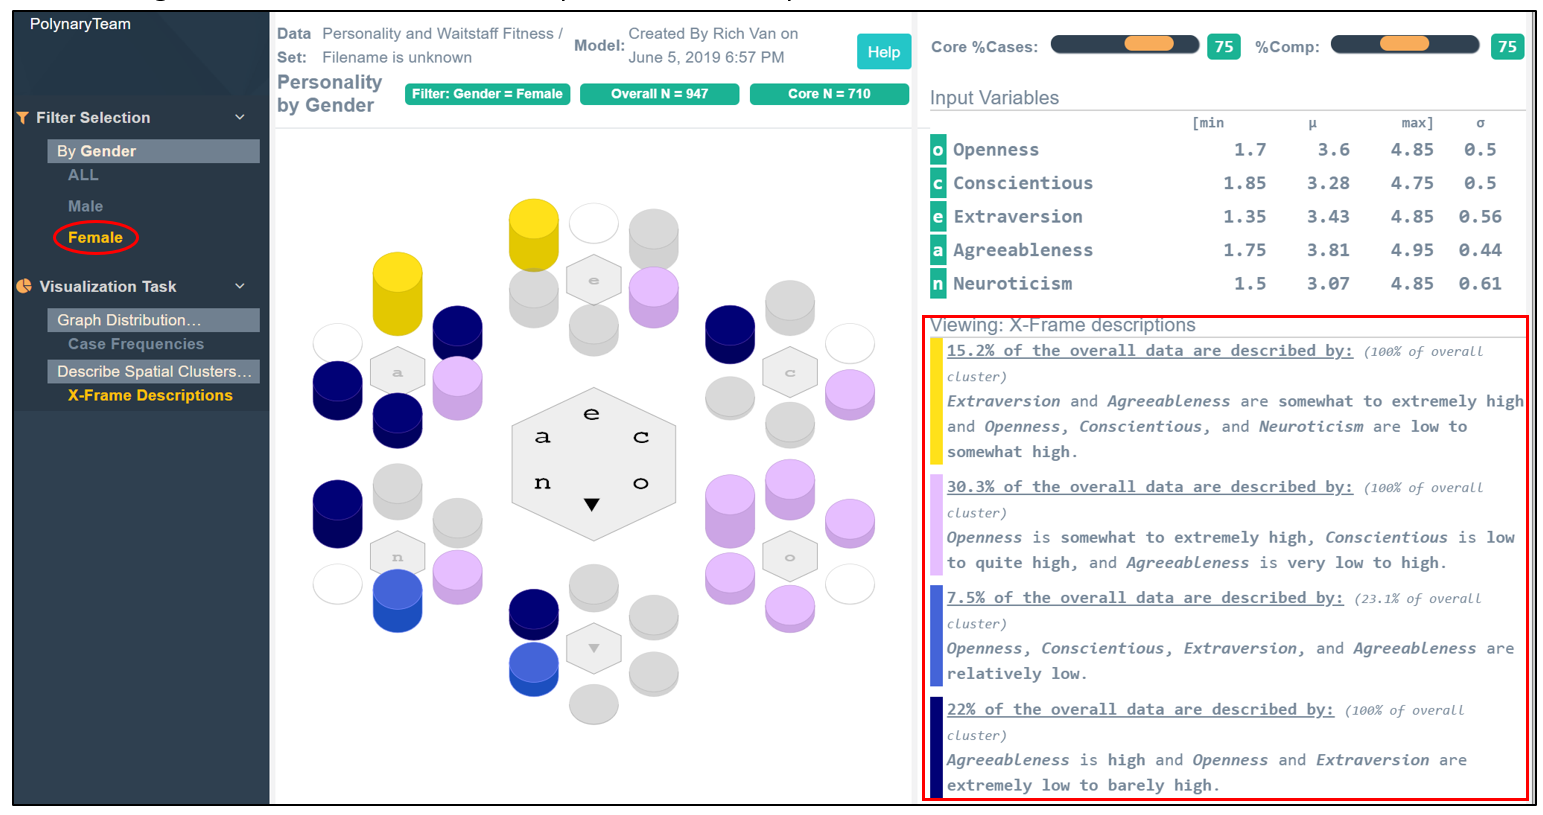
There is one more program feature to show. We may want to compare different collections of objects. In this example we wanted to compare the descriptions of male and female personalities. To enable this, we added gender as a filter to the personality model.
Filtered categories are processed independently. By clicking on male, we show the descriptions of male personalities.

And clicking on female, we see the descriptions of female personalities.
And as before, we can show the multivariate distributions of personalities. Clicking on Case Frequencies we see the profiles of 947 female personalities;

And the profiles of the 358 male cases in the sample.

Concluding Remarks
The 400-year-old Cartesian coordinate system conflated the concept of a dimension with three spatial directions. Until about a hundred and twenty years ago even mathematicians resisted the concept of higher-dimensional spaces—claiming they could not correspond to anything real! A few years later, Einstein had his 4-dimensional space-time. It is false to say we’re limited to three dimensions; people have been thinking and talking about ideas more complex than this for millennia. For instance, we characterize weather through combinations of temperature, humidity, and how windy and sunny it is.
What has been lacking is a geometric way to visualize high dimensional spaces. By equivalently representing Cartesian coordinates as relative coordinates and transforming them into Polynary strings, we finally have a way to graph high-dimensional data on a two-dimensional surface in a coherent way. This enables a tangible way to directly see and share empirical data through the Polynary coordinate system. And this extends spatial reasoning into the high-dimensional realm most folks previously had no way to imagine.
Geometrically, a Polynary string denotes a region of space within a unit-cube. And the ‘spelling’ of this string corresponds to the way we describe objects falling into this region by noting what, and to what relative degree, their dimensional features stand out. A quantitative description connotes the location, size, and shape of a chunk of conceptual space.
We have generalized this connection. We can connote any region denoted by any connected set of basins through a description. Description is an ingenious device of language that allows us to form generalizations that reflect different levels of detail in a seamless way. As Descartes united geometry and algebra, Polynary unites geometry and language.
This is an important connection. The summary conclusions sought from data are descriptions of the spatial patterns and relationships formed by collections objects. And these features can assume arbitrary shapes and sizes within a conceptual space. Polynary graphs reveal these patterns and relationships to the best pattern detectors around, our own eyes. These structures become evident when graphed, and their descriptions create the conceptual bins people use to characterize them. The language-based rules-of-thumb we pass around as knowledge, the generalizations and claims made about quantitative ideas, are all expressed through descriptions.
We’ve introduced a new approach to the task of characterizing a collection of like-objects. In other paper we extend Polynary to problems of classification by showing how we draw distinctions between different categories of objects through different descriptions. And we extend Polynary to explanation by noting that we use pairs of descriptions when we explain something in terms of something else.
Data are now ubiquitous, but traditional data analysis remains a technical art that excludes most people. But this art has limitations we tend to ignore. Descriptive statistics summarize properties of measurements; people summarize objects with words. And the practice of plotting a few dimensions at a time through Cartesian plots does not allow us to see the high-dimensional patterns that objects form. Consequently, the recourse to statistical modeling is done blindly, and their interpretation understood through parameter values of ‘marginal effects’ of model terms.
These are forms of reductionism disconnected from how most people know things. Polynary recognizes that people generalize over objects, not measures. And that the real endgame of data analysis is to turn numbers into words. Supported by pictures of the empirical evidence to back them up, those words become powerful indeed. These are the human currencies of communication.
Polynary removes the technical barriers to data analysis to democratize the use of data. Polynary methods rest on the general human ability to identify useful frames. A frame is the set of concepts that provide a good way to think and talk about something. We all have mental models, frames that reveal how we think some piece of the world works. Advances in quantitative science and better decision-making is really about the evolution of ‘better’ frames. And this is a game that, with appropriate data, anyone can now play.
© PolynaryThink, LLC 2019 All Rights Reserved